The growth of CO2 emission has been found to have paused, says S.Ananthanarayanan.
The action in Paris where the nations of the earth are working out a scheme of acting together to contain global warming is a mix of dealing with statistics, science, interest groups and political constraints, with the special feature that there can be no separate winners or losers, everyone loses or gains at the same time. The journals, Nature Geoscience and Nature Climate Change, have come out in the same week as the conference with a collection of papers with comment and analyses of the reality and implications of the problem and the avenues available.
Reto Knutti, Joeri Rogelj, Jan Sedlácek and Erich M. Fischer, from Zürich and Laxenburg, Austria define the perspective in Nature Geoscience by observing that what matters is not whether we stay within the ceiling of 2°C or less than that, but the quantity of CO2 that we send out into the atmosphere. Global temperature depends on complex factors and while it is certainly linked to CO2 emission, and it (2°C) is a target that governments can easily understand, temperature alone cannot reflect harmful trends of ocean acidification or total heat gain by the planet, they say.
And coming to CO2 levels, Robert B. Jackson, Josep G. Canadell, Corinne Le Quéré, Robbie M. Andrew, Jan Ivar Korsbakken, Glen P. Peters and Nebojsa Nakicenovic from Stanford, Canberra, Norwich, Oslo and Laxenburg, Austria, writing in Nature Climate Change, find that mitigating efforts, largely steps taken by China, seem to have started the turn of the tide by halting and even reversing the rate of growth of CO2 during the years 2014 and 2015.
The twenty three years that have passed since the Rio de Janeiro conference of 1992 have seen little progress in holding down emissions, but many ‘milestones’ have been attained in the opposite direction, they say. Fourteen of the fifteen hottest years on record have occurred since 2000, and in 2015, global warming reached 1°C, the half-way mark to the declared limit of 2°C. In 2015, average monthly atmospheric CO2 concentrations reached 400 parts per million, for the first time in at least 800,000 years and we have now used up two thirds of the total carbon we can send into the atmosphere before we lose a 66% chance of limiting global temperature increases to below 2 °C.
Dip in emissions
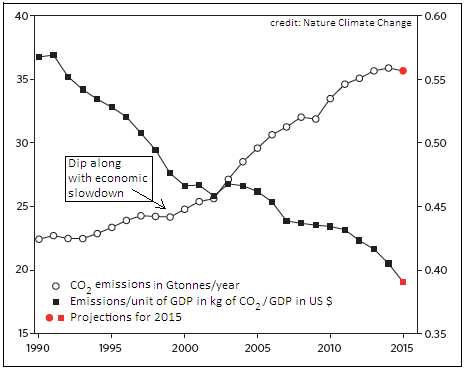
But finally, in contrast, they say, there has been a dip in the global increase in emissions, with the addition of CO2 by burning fossil fuels and by industry growing during 2014 only by 0.6%, against the average of 2.4% annually during the preceding decade. And the estimate for 2015, based on data available till October, is a reduction by 0.6%, a fall from 35.9 Gigatonnes of CO2 in 2014 to 35.7 Gigatonnes in 2015. Not that fall in emissions has not taken place before, it did happen during the break-down of the Soviet Union and the Asian financial crisis, in the late 1990s and 2000s, where there was economic slowdown. But this time round, the paper notes, the decline in emissions is while the world economy has been growing, at 3.3 to 3.4% a year
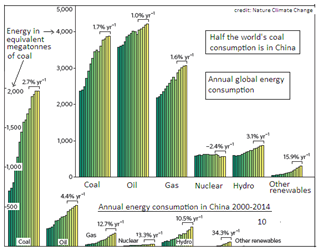
The paper notes that the present decline despite sustained economic activity is on account of less use of coal, majorly in China, evidently through more intense use of renewables, like hydroelectricity, wind and solar energy. The bar chart shows that while coal consumption China, which is half the world-wide figure, has stayed unchanged during the two years, there is more than compensating increase in renewables, mainly hydroelectric, with a similar trend world-wide.
The world is looking for a total reduction in emissions by about 350 Gtonnes of CO2 between the years 2000 and 2050. A handy way of strategising this target is to think of mitigation in terms of ‘wedges’ , each of 90 Gtonnes, at least seven of them being required. To qualify as wedges, wind and solar power need to grow and replace fossil fuel use by 2,000 GW each within the 50 year period. Installed capacity for wind power reached 370 GW in 2014, with 51 GW added during the year. 23 GW out of this was added in China, which is now the world’s largest producer of wind energy. Power from solar cells also rose from 3.7 GW in 2004 to 178 GW in 2014, with 40 GW added during the last year. With incentives offered by most states to use solar power, the growth is likely to be sustained and wind and solar power seem to be on the way to reaching the 2,000 GW mark by 2050.
Another partially successful strategy has been control of land use based emissions, specifically deforestation. The paper says that emissions from change of land use of about 5.5 Gtonnes per year in the 1990s dropped to 4 Gtonnes in the 2000s and is at 2.9 Gtonnes in the current decade. The potential of nuclear power is also limited, the use in fact is declining, as nations are cutting down capacity for safety reasons. Other strategies are the Negative Emission Technologies, like use of biomass with carbon capture and storage, chemical capture of CO2 or promoting weathering of minerals, to capture CO2. The journal, Nature Climate Change has a paper by a multinational group of researchers into the biophysical and economic limits to the effectiveness of these methods.
Which brings us back to the need, basically, to limit the amount of CO2 getting out there. While China, now the highest emitter of all, after decades of massive industrialisation powered by coal, seems to be showing the way, the EU has also shown decline in emissions, and this is after correcting for the element of manufacture that they transfer to other countries.
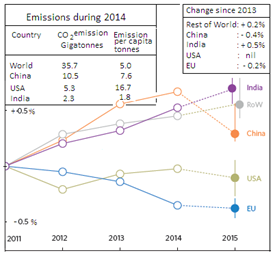
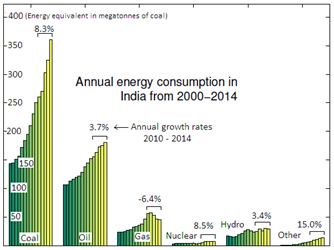
Despite the marginal dip, however, the actual emission continues at more than 35 Gigatonnes a year. India, at 2.4 Gtonnes today, is like China in 1990, but the annual emission per capita is just 1.8 tonnes, against 7.6 in China and 16.7 in USA. With the need to improve living conditions, including providing basic electricity to 300 millions who have none, India’s emissions are likely to grow to 4.5 Gigatonnes per year by 2030, when the annual emission per capita would still be just 3 tonnes.
Even China, with a per capita GDP only one fourth that of USA,, would grow and even with its stated ‘Intended Nationally Determined Contribution’ of reduction of the emissions per unit GDP by 60-65%, its total emissions are likely to be at 11.3 Gigatonnes in 2030, against 9.9 Gigatonnes today. The only solution seems to be that China sustains its pace of change-over to renewable sources of energy and other coal based countries do likewise. In the meantime, the State Council in China has pledged to cut pollutants by the power sector by 60% by the year 2020. The Government has also banned the use of low grade coal and has set a ‘bottom line’ of 310 grams of coal to generate one kwh. India, which has only 77 GW of low carbon capacity installed, out of the total of 280 GW and just 4 GW of solar power would need to take dramatic measures to increase the share of renewables in generation. But apart from the source of electricity, India could still make a good showing by revamping its electrical distribution grid, as India faces record line losses of its scarce and expensive electrical energy.
------------------------------------------------------------------------------------------
Do respond to : response@simplescience.in
