Export of electricity is a transfer of resources too, says S.Ananthanarayanan.
The raw material that goes into a finished product is sometimes not apparent. Direct material, labour, energy and overheads are regularly accounted for. The value of a resource, like water which has been consumed in generating electricity, however, does not get measured when electricity is metered.
Christopher M. Chini, Lucas A. Djehdian, William N. Lubega and Ashlynn S. Stillwell, from the College of Engineering, University of Illinois, in the journal, Nature Energy, consider the distribution of electricity over the grid as a case of virtual export of the water that goes into production of electricity. They divide the water used according to its quality and the extent of its degradation and analyse its movement, not physically, but virtually, along with the electricity that flows from the point of generation to centres of distribution and consumption.
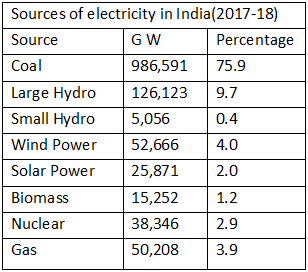
“Thermoelectric power plants account for 90% of electricity generation in the United States and are the largest withdrawers of water in the country. In addition, water is consumed via evaporation in hydropower”, the paper says. The sources of electricity in India are similar, 84% from coal, biomass, gas and nuclear and 10% from hydroelectric plants. The study based on the US would hence be equally relevant to India.
The paper describes the water footprint of electricity generation, as an analogy of the water footprint of food, as either blue or grey. In agriculture, the blue water footprint is the consumption of water from rivers or lakes that is consumed for irrigation, and the green water footprint is the water from rainfall. Grey water is the water that is used to dilute and assimilate pollutants. In power generation, the blue water footprint is in the case of cooling towers of thermal plants and the evaporative loss in hydro plants. Grey water in thermal plants is the run-off which carries heat, thermal waste, into the environment. This run-off water can be dangerous to fish and plant life and most states have regulations of how far this water needs to be cooled.
The network that the water footprint of food forms with the food trade has been studied to create regional maps of how virtual water gets transferred, underlining the dependence of consuming centres on the aquifers in producing regions, the paper says. “However, the coupling the water footprints of electricity with electricity transfers, to map and determine the changing properties of the electricity-virtual water network is a relatively understudied, but important, area of the energy–water nexus”, the paper says.
The paper points out that unlike food produce, which is physically transported, with identified points of supply and consumption, in the case of electricity, all production centres are simply connected to the grid. Electricity produced at a centre then loses its identity and consumers can be connected anywhere over the national or even international grid. As electricity carries with it a component of embedded resources, such as water, it is important to understand the dynamics of consumption of resources that are transferred.
Traditionally, the policies have sought to minimize the resources consumed at the supply side, the paper says. Details of the end-use water footprints, however, are necessary for planning, policy and for conserving resources. Studies conducted over a limited geographical area and not over an extended period have not been able to make this available. The University of Illinois group hence combined the existing regional studies to create a network of electricity transfer data covering the whole of the United States, over a seven year period, from 2010 to 2016.
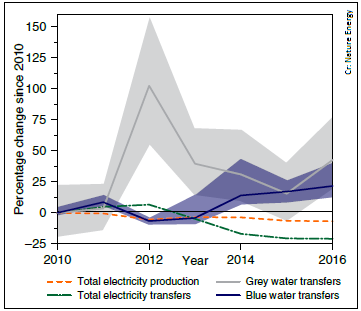
A noteworthy trend in the transfer of virtual water is displayed by the graph. While the total electricity production went down, from 2010 to 2016, and the transfers remained unchanged, there was substantial increase in the transfer of virtual water. While the peak in 2012 can be explained by the nation-wide drought in the US, there is rise in other years too.
The study was designed as a network where the nodes were the Power Control Areas (PCAs, where the output of a number of nearby plants is managed) and the value of the links between nodes, which is called the ‘weight’, was the embedded water resources in the transfer. An example is the network of blue water transfers, shown in the picture. Analysis of the networks threw up a number of conclusions. For instance, it was seen that the nodes which had the most number of connections to other nodes were the ones managed a greater share of virtual water. The relationships between the virtual water handled and properties of the network then provides direction for PCAs to minimize their water footprint by selecting the electricity they import, as well as the potential for policies to intervene.

The study provides a mechanism to identify the points of consumption that intensify water water-use pressure on points of production. “A potential burden shift” and regional and seasonal interdependence, the paper says. There could then be levies and subsidies, to incentivize, as well as selection of the mode of development of industry in different regions, to minimize and rationalize water consumption.
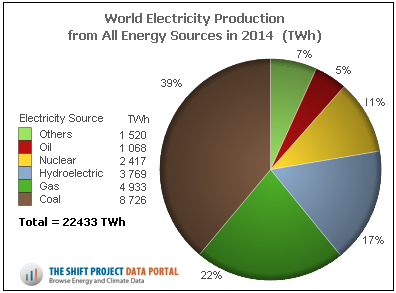
Scientific rationalizing of costs and benefits would go a long way stabilize markets, equalize opportunity and optimize resource use, in all parts of the world. There are groups that have been protesting the virtual nuclear waste that is carried by electricity produced in nuclear plants in one country, but exported to another country. The production of electricity all over the world, which carries virtual water resources, is still 94% from conventional thermal (include nuclear) and hydroelectric sources. This is likely to be the dominant source for many decades, during which the world would get progressively more water-stressed.
------------------------------------------------------------------------------------------ Do respond to : response@simplescience.in